Registered users of the Genome-Phenome version can try this out by downloading our tiny demo (choose trio or beyond trio version), containing:
- Phenotype: An anonymized patient summary PDF file
- Genotype: a tiny simulated variant file for a trio (proband, mother, father).
Load the patient summary into the software. Then using the Load button on the top black navigation bar use Variant File Load. Then click Dx on the top black navigation bar, where you will set a Genotype tab:
The Genotype tab
Explore:
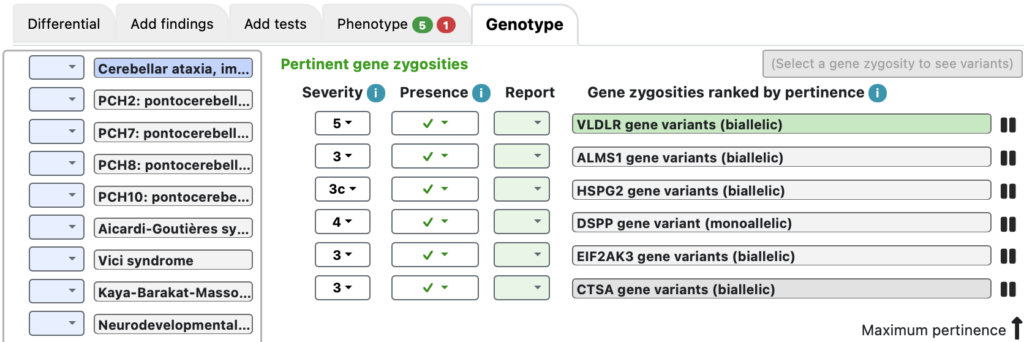
The Genotype tab shows plausible gene zygosities that were found based on the variants, the affected status of the individuals, and the severity assessments of the zygosities.
Mini-variant table
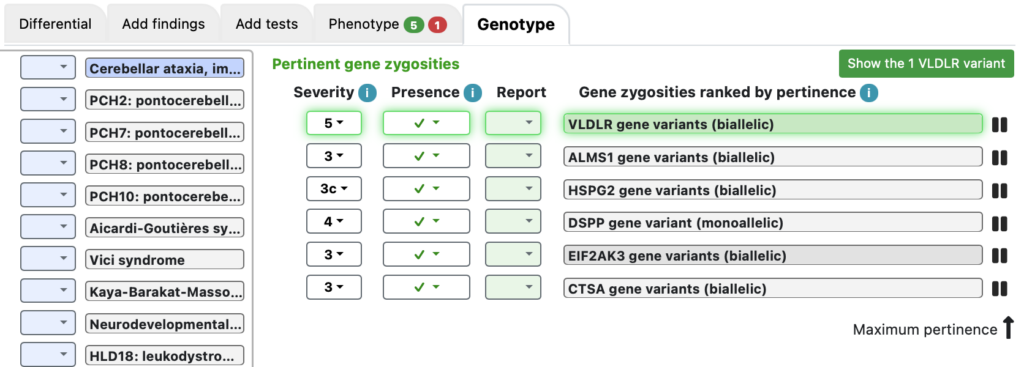
Here, VLDLR gene variants (biallelic) is #1, with severity 5. Clicking on that activates a green button “Show the 1 VLDLR variant”.
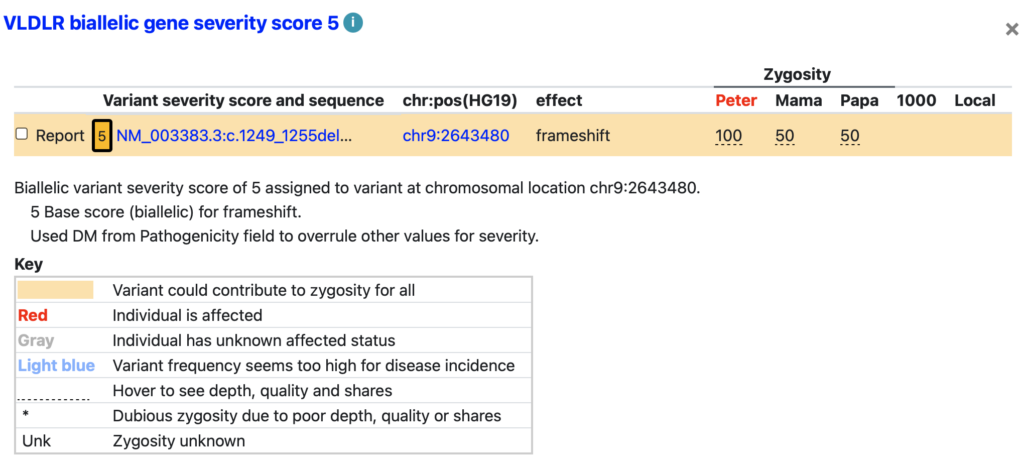
Clicking that button pops up a mini variant table.
- Color: In the mini variant table, affected individuals are named in red.
- Visible information: Each line has a variant with sequence annotation (with ClinVar link), chromosomal position (with UCSC Genome Browser graph link and with genome assembly specified), effect, and zygosity in each individual (with names derived from the variant table).
- Hover: Hover over a zygosity to get depth and quality scores for that individual.
- Severity details: The basis for the severity is explained below the orange part of the mini variant table. Such explanations can include functional and conservation scores, homoshares information, and other relevant details, such as high-frequency or excessive de novo variants in the variant table.
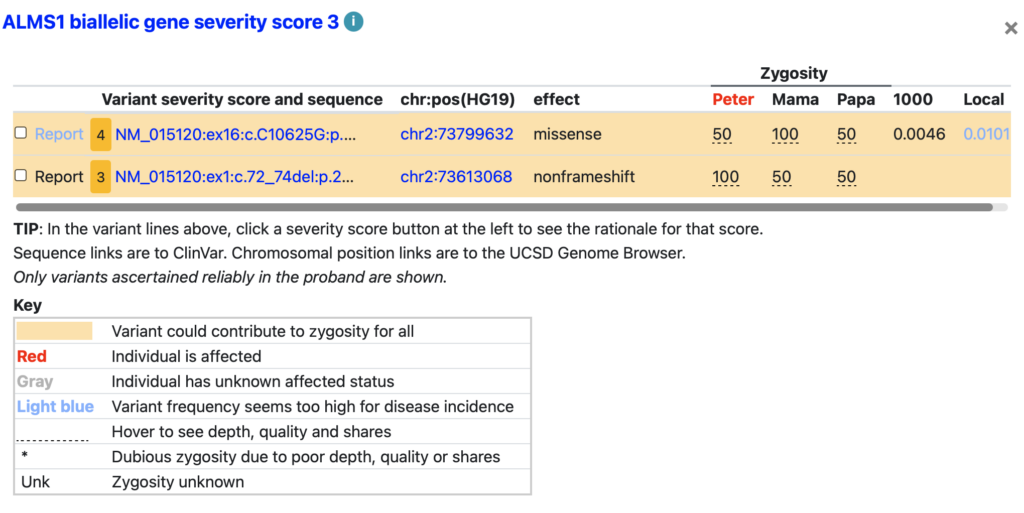
Variants with frequency above disease incidence (e.g., ALMS1)
Explore variants for other genes and you will see some with blue shading, indicating a variant that seems too frequent given the incidence of the disease.