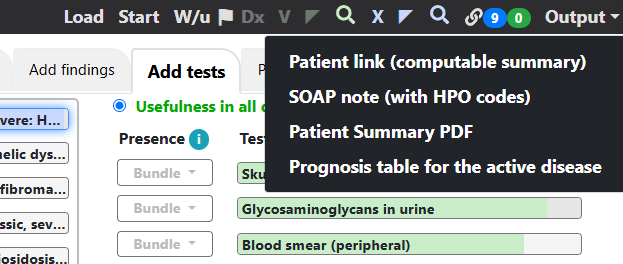
You have several options for documenting and sharing results.
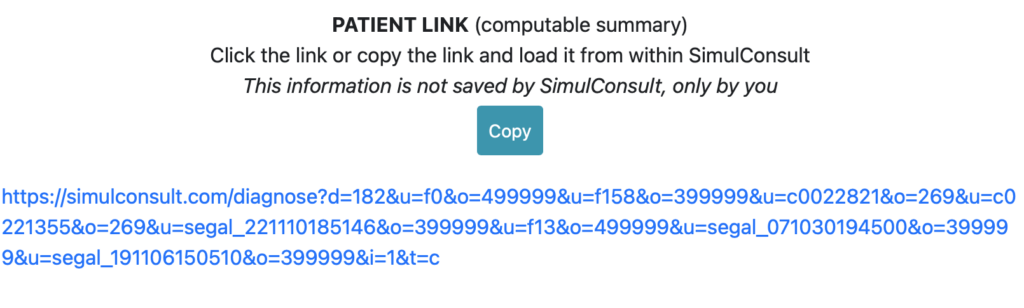
Patient link (computable summary)
Go to Output on the black navigation bar and select Patient link (computable summary). Use the Copy button to copy the computable summary. It is a URL that encodes the patient’s findings; clicking on the link launches the software with the patient findings already entered. You can also use Load on the black navigation bar if SimulConsult is already open. Using Load automatically clears all previously entered findings.
- The link is machine-readable.
- It contains all findings and their presence information in an anonymized record, as well as foreground/background information for each finding.
- It can be emailed or saved (such as in the non-patient-visible portion of the chart). Doing so makes it fast and easy for colleagues to collaborate on a patient, even with the standalone version (as opposed to versions integrated with the electronic health record).
SOAP note (with HPO codes)
Selecting SOAP note (with HPO codes) from Output on the black navigation bar creates a plain text editable note in the standard Subjective, Objective, Assessment, and Plan format. You can copy and paste the note into the chart. It is editable, so you could shorten the list of diseases shown in the differential diagnosis to the ones for which you are ordering tests, and shorten the list in the Plan in the same way. The Human Phenotype Ontology (HPO) codes are automatically included, with links to the full ontology.
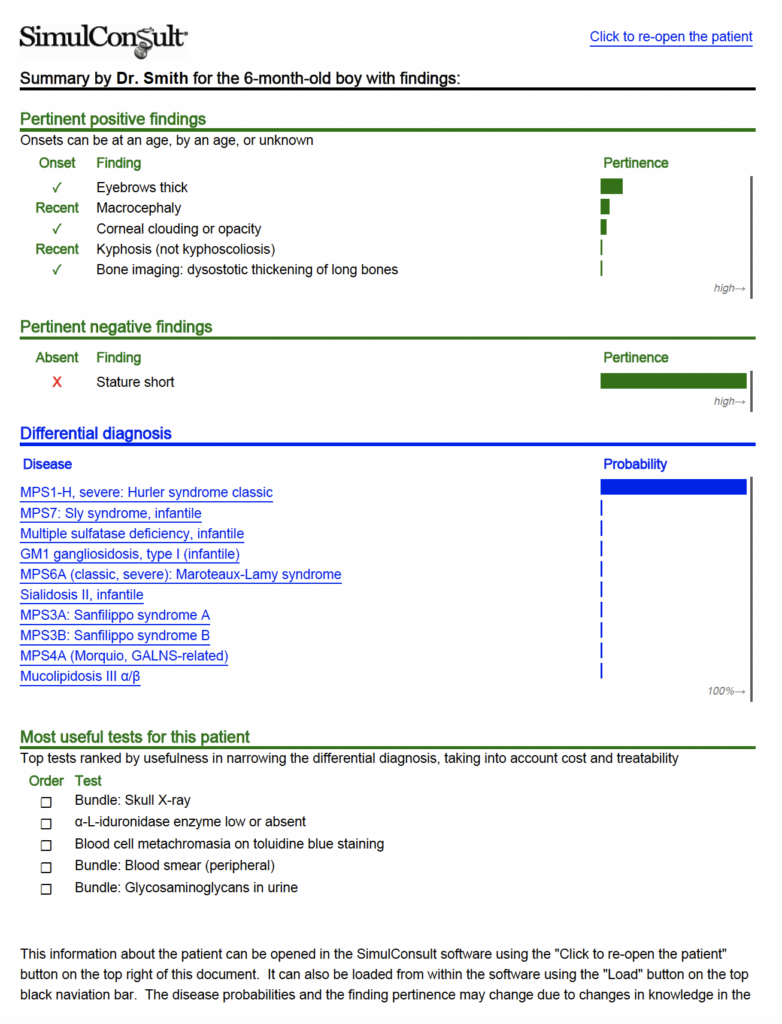
Patient Summary PDF
The Patient Summary PDF accessed from Output on the black navigation bar is a graphical display of the patient’s Phenotype and the differential diagnosis. Some centers have used it in their communication with payers to make the clinical thinking explicit, and indicate consideration of cost and treatability, resulting in accelerated approvals.
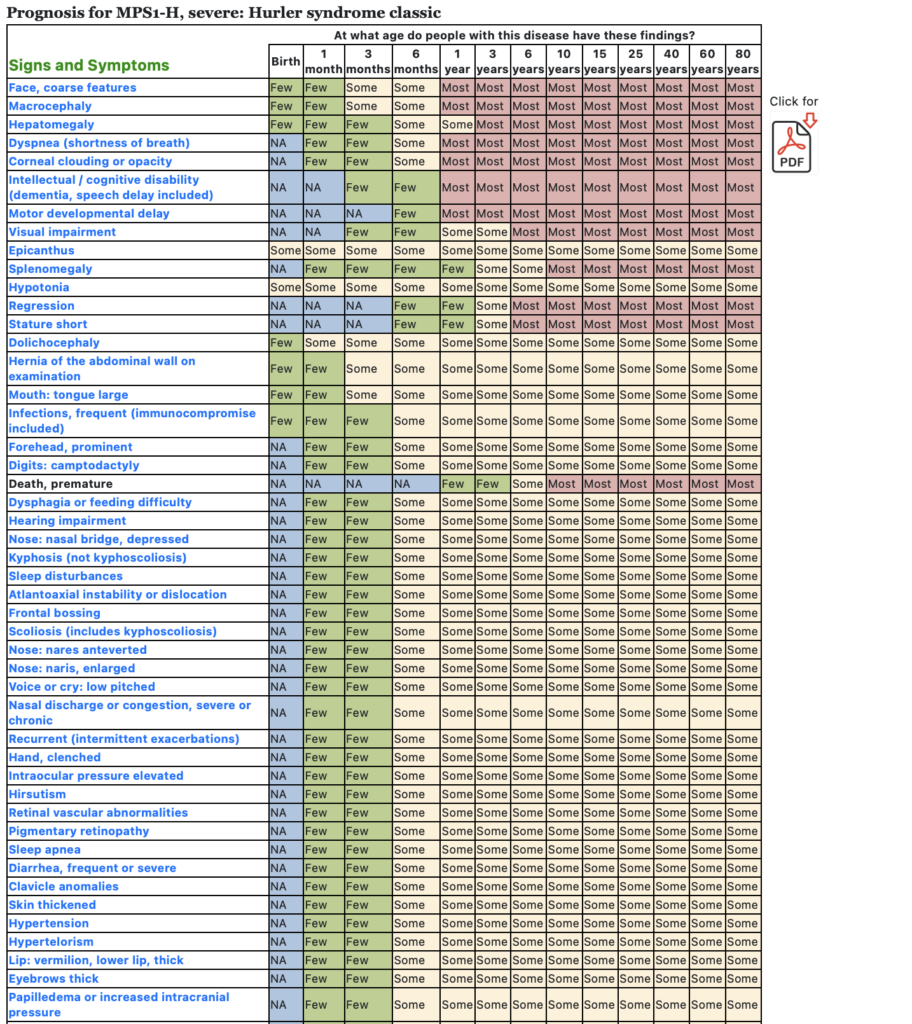
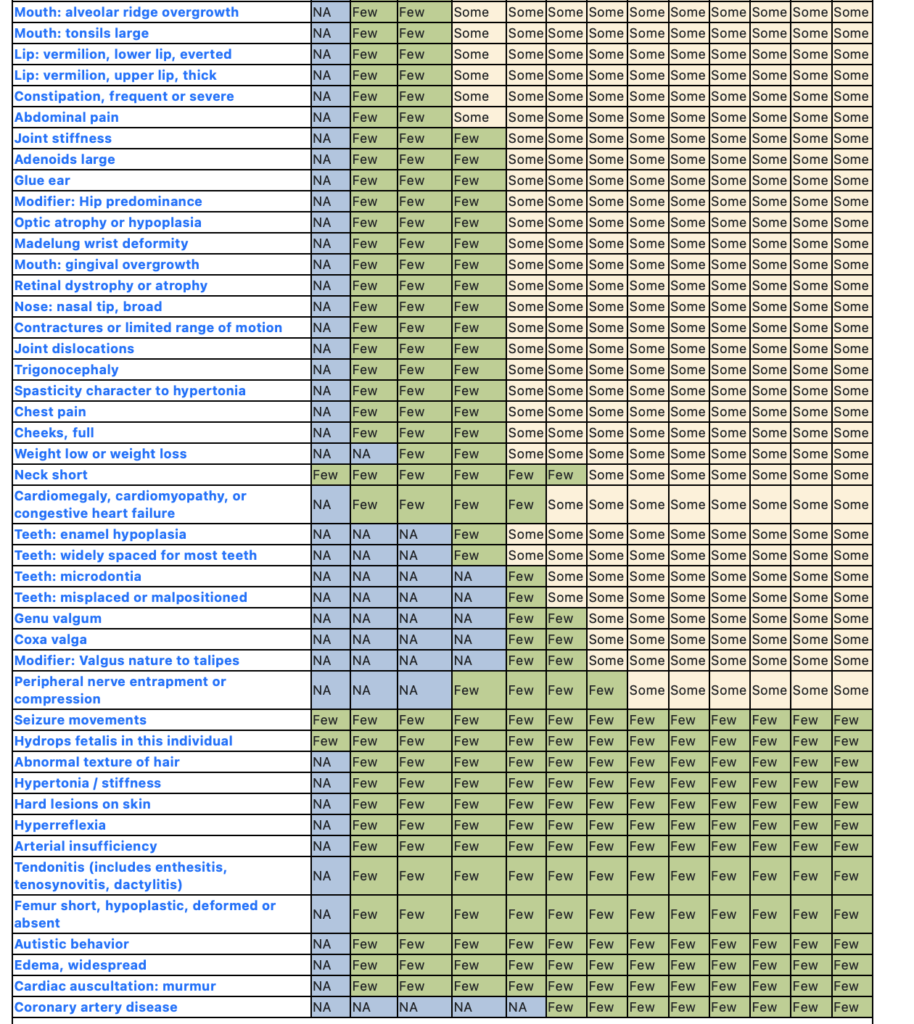
Prognosis Table for the active disease
The Prognosis Table is designed to quickly answer the first patient question after a diagnosis is made, namely, “What should we expect?” Once you have selected the disease that you wish to display, the Prognosis Table can be accessed from the Output section on the black navigation bar. The Prognosis Table summarizes the findings (clinical and test results) known to be associated with a disease, their frequency, and the onset.
PCORI-funded research showed that it is well-liked and well-understood.
- Patients say, “If the disease remains untreated, we are likely to get most of the red findings and some of the others…”
- Primary care clinicians find it helpful in two ways. (1) Understanding that there may be a risk of cataracts allows them to stay on top of ophthalmology appointments. (2) Distinguishing findings not associated with the diagnosis that may indicate the presence of a second condition.