The Genome-Phenome Dashboard is the advanced tier of the Dashboard products. It includes all the features of the basic Phenome Dashboard and adds the ability to use annotated variant tables and microarray data for rapid clinical correlations.
SimulConsult can help with the clinical correlation for genomic testing. After uploading an annotated variant table (an image of an anonymized excerpt is shown below), a Genotype tab appears, listing the abnormal genetic results that have known associations to disease. These “gene zygosities” are ranked by pertinence to the clinical situation, a property that points to the pathogenic genes. In the image below, the VLDLR gene has 100% of the pertinence (green shading), corresponding to the disease VLDLR-related cerebellar ataxia (cerebellar ataxia, impaired intellectual development, and dysequilibrium syndrome; blue shading on the left).
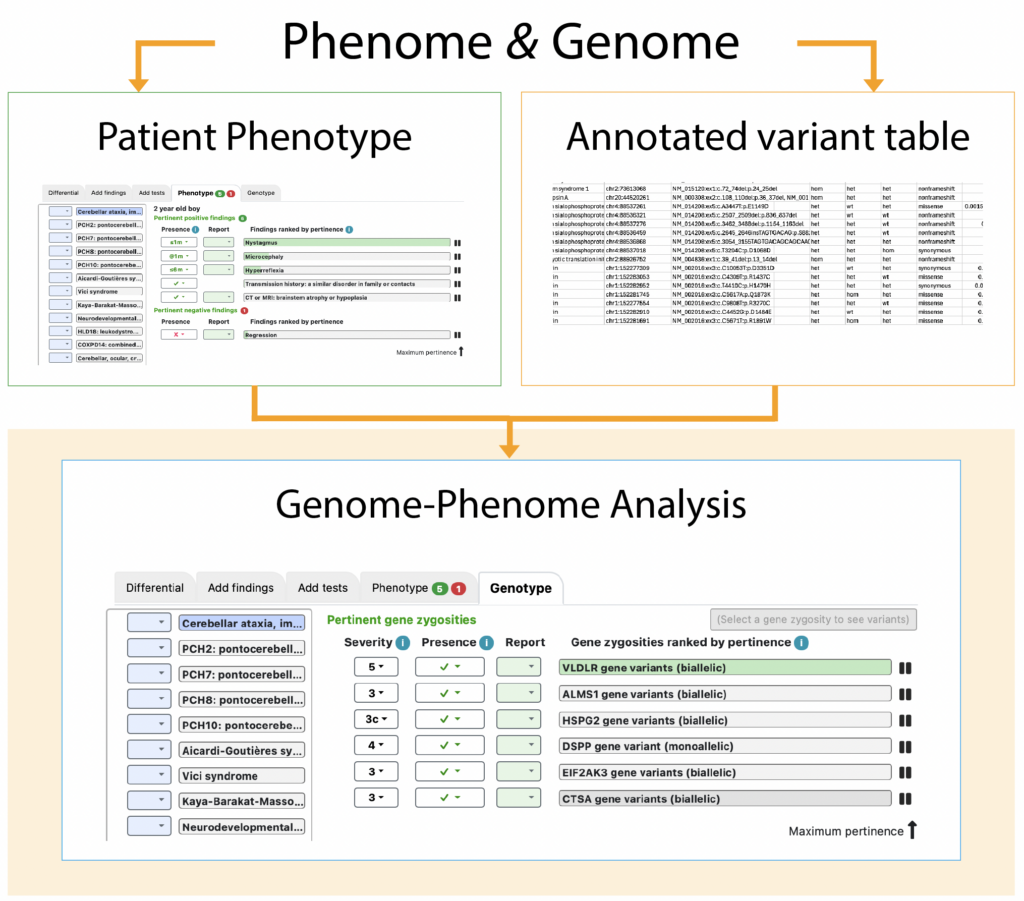
Highlighting a gene zygosity makes available a button to show a mini variant table with the relevant gene variants (right, near the top of the image of the software), including many key details, such as whether the variant is too common to account for the known frequency of the disease.
A geneticist can analyze genomic results in minutes and use the Report components to document the evidence for the clinical correlation as part of the return of results to the patient.
Key requirement
To make use of the Genome-Phenome Dashboard, you must have access to annotated variant tables, not just plain VCFs. Most external labs will only share plain VCFs; they regard their annotations as proprietary. However, many academic medical centers have the ability to generate annotated variant tables for at least some of their patients. Such information is stored in databases that can readily generate the required file.
Benefits
Combining an annotated variant table with patient findings to arrive at a differential diagnosis is labor-intensive and costly when done manually. SimulConsult’s integrated Genome-Phenome Dashboard dramatically reduces the time involved and employs a hypothesis-independent approach to analysis, promoting accuracy.
Read a study about the Genome-Phenome Dashboard.
How does the Genome-Phenome Dashboard work?
It combines the power of the following 2 inputs:
- Clinical findings and lab tests input by the user, providing phenotype information to be compared to the phenome.
- Annotated genomic variants, providing genotype information to be compared to the genome.
Combining the genome and phenome perspectives using a “pertinence” metric allows for a hypothesis-independent approach that is more powerful and efficient than doing the approaches manually or sequentially.
How long does the analysis take?
The software analysis takes seconds and the whole process takes less than 10 minutes for a typical patient – saving hours of time. Full trio (proband, mother, father) support is included, with novelty and compound heterozygote analysis.
What is distinctive about SimulConsult?
The approach is distinctive in being hypothesis-independent in not requiring assumptions about the mode of inheritance, the number of genes involved, or which clinical findings are most relevant. While in some clinical situations, it is possible to construct a panel of genes that are relevant (e.g., for centronuclear myopathy), but in many other situations, the clinical picture is less pathognomonic and a more robust clinical analysis is needed.
The approach is also distinctive in that the clinician is “in the loop” and is prompted about other useful information that can help distinguish among the variants found. Because the information about diseases and the information about the patient increase over time, this allows the clinician to perform re-analysis of the genomic information when desired.
The analysis is enabled by a curated, evidence-based, computational database of diseases and findings, and is combined with a Bayesian approach to enable it to reason from pertinent positives and negatives. This approach allows use of timing of onset and disappearance information about individual findings, along with family history, and taking cost into consideration in test recommendations. More details about the approach and the efficacy are in a study published in the Journal of Child Neurology.